Puzzling Out Brew House Efficiency
¶ by Rob FrieselGenerally speaking, Brew House Efficiency (BHE) is number, expressed as a percentage, that calculates how efficient your wort production is — i.e., how much of the potential fermentables actually make it out of the grain and into your fermentor. The calculation is comprehensive, and accounts for (among other factors) how much of the grain’s starches were actually converted to sugars, and how much of the produced volume was lost to losses like absorption and transfer losses. 1
When I was new to all-grain brewing, BHE was not a number that I kept track of. It wasn’t that I didn’t know about it — it was that with everything else to learn, I just wanted to see if I could pull it off at all and then maybe I could start to quantify and use those numbers for process improvement. That said, I probably started to care about BHE numbers after about a year of partial mash brewing 2 and then another year (coincidentally, when I moved from partial mash to all-grain BIAB) before I started tracking it consistently. 3
And that being said, it took me another two years to finally get around to actually looking at all the compiled BHE data. (Guess I just needed enough of it?) The main question I found myself asking: Why is it that my BHE numbers are usually lower (and further off) for my higher gravity beers?

My thinking went something like this:
- After a while of taking BHE readings for a few brew days, the average seemed to hover around 70-72% given my setup.
- I started using 72% as the basis for my recipes, plugging that into BeerSmith and dialing in the numbers from there.
- Lower gravity beers seemed to hit (or exceed) their target O.G. more often than not — and then they missed, it wasn’t by much.
- Higher gravity beers seemed to miss more often than not, and by a significant margin.
- Given 3 and 4, where was the breakpoint? Where was the target O.G. above which I should just plan to use a lower BHE?
I’d heard this before. I’d read a few articles and blog posts that mention using lower BHE for planning high gravity beers. Hell, if you look at the recipes in Modern Homebrew Recipes (Strong, 2015), you can see that relationship between the O.G. and the BHE — e.g., 75% for the 1.048 West Coast Blonde vs. 60% for Sara Bonnyman’s Wee Heavy at 1.087. 4
But other than cautioning brewers that high gravity beers will have lower efficiencies, none of these sources really indicate why to expect lower BHE, nor what constitutes “high gravity” in the first place.
This is what I set out to learn — and even if I couldn’t get to the root of the former, maybe I could at least make some inferences about the latter.
The Data
Naturally, the first step is to collect and organize the data. As mentioned before, I’ve been collecting these data for about as long as I’ve been brewing. I already had target and actual O.G. for every beer going back to my first, and pretty good coverage on the measured BHE for beers from the past 2 or so years. Getting the BHE numbers for the missing beers was easy — just pull them up in BeerSmith and enter the missing data into the spreadsheet.
With the data loaded into RStudio, I set about trying to visualize these relationships.

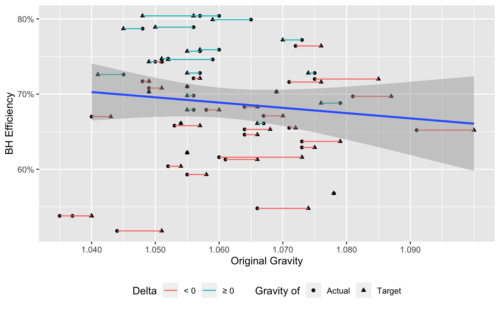
I plotted the beers according to three dimensions: measured BHE along the x-axis, and then their target and actual O.G. on the y-axis. To help myself understand where each beer fell, I also drew a line at the 72% that I’d used as the assumed BHE for most of those beers.
At first glance, the plot makes it look like I’m under my target O.G. more often than I’m at it or over. Looking more closely at the numbers, this is true, but not dramatically: 27 times under vs. 25 times at or over. Visually, there appear to be some other trends: (1) most of the “over” beers have target O.G. ≤1.060, (2) target O.G. >1.070 seems to coincide with a significantly 5 larger negative delta, and (3) BHE numbers are mostly clustered in the 60-70% range.
Now, back to my original question: Is there a breakpoint where I should start using a different BHE in my recipe calculations? Acknowledging that this is probably more of a curve than a specific point — I (semi-arbitrarily) picked 1.065 as the boundary condition and re-generated the graph.

This time I added a horizontal line to illustrate where that 1.065 boundary condition was, as well as a red vertical line to indicate the median BHE for beers ≥1.065, and a blue vertical line to indicate the median BHE for beers <1.065. This breaks down the beers as follows:

Interesting! Beers with a target O.G. <1.065 hit (or exceed) that number more often than not (though not by a wide margin), while beers with a target O.G. ≥1.065 miss it more than 2-to-1. And what about the BHE numbers?
| Target Gravity | Delta | Avg. BHE (%) |
|---|---|---|
| <1.065 | <0.000 | 66.4 |
| ≥0.000 | 74.6 | |
| ≥1.065 | <0.000 | 65.3 |
| ≥0.000 | 69.6 |
OK now I feel like we’re getting somewhere. There is more variance within those two groups (i.e., ≥1.065 vs. <1.065) than I’d originally anticipated, which means that it looks like there is less of a difference overall. But using our favorite measure of central tendency (median!) across all the beers within each group, we get some encouraging results:

Conclusions
Making some inferences from that boxplot, it seems that:
- For target gravities <1.065, I can continue to design around a 70-72% brew house efficiency.
- For target gravities ≥1.065, I should change up my recipe design and start calculating with 65% brew house efficiency.
If we apply a generalized linear model to these data (BHE as a function of target O.G.), these conclusions mostly hold up.

This model suggests lower BHE generally, despite the relatively high number of beers with BHE >75% with target O.G. <1.065. That being said, the model is close enough to my intuitions that I’ll follow my conclusions into 2020 and see how well they predict BHE on beers in those two groups.
Further Questions
Though I feel reasonably confident about the 1.065 breakpoint on my system, I also feel like there are other factors at work here. Having done this analysis, I find myself asking a few more questions:
- How did those measured BHE numbers compare to the expected BHE used in the recipe calculations? (I believe I used 72% for most of them, but not all. What would those comparisons look like?)
- What factors can account for the variance in delta between the actual and target original gravities?
- What factors can be manipulated to help keep BHE more consistent? …to improve the overall BHE? Some factors worth considering in future analyses:
- Grain crush size?
- Overall diastatic power of the grain bill?
- Percentage of non-diastatic grain (e.g., crystal or roasted malts, raw grain) in the grain bill?
- Mineral concentrations in the mash liquor?
- pH of the mash?
- Length of the mash?
- Mash schedule? (e.g., single infusion vs. step mash)
- Boil-off rate?
- And (perhaps most important) the original question remains unanswered: Why does BHE appear to go down as target gravity goes up?
Other Resources
- How to Calculate Brewhouse Efficiency :: Kegerator.com
- Brewhouse Efficiency Calculator – Brewer’s Friend
- Brewhouse Efficiency vs Mash Efficiency in All Grain Beer Brewing | BeerSmith Blog
- Ask the Experts: Mash Efficiency | Craft Beer & Brewing
- Improving Brew House Efficiency for Small Brewers
- 6 Tips for Improving Mash Efficiency | E. C. Kraus
- That is a simplified explanation, but good enough for our purposes here. If you want a more detailed and technical explanation, check out the links in “Other Resources” at the end of this post.[↩]
- The first time my notes include any mention of BHE was with Sirius Moonlight.[↩]
- This would be starting with Jade Weka.[↩]
- Sharp-eyed readers will note that there’s the 1.034 NHC Mild is listed at 55% so I’ll just retort that this is more of a pattern or heuristic and not necessarily a rule.[↩]
- Yes, this is a stats-oriented blog post; no, I am not using “significantly” here in the statistical sense — but I probably should.[↩]
About Rob Friesel
Software engineer by day. Science fiction writer by night. Weekend homebrewer, beer educator at Black Flannel, and Certified Cicerone. Author of The PhantomJS Cookbook and a short story in Please Do Not Remove. View all posts by Rob Friesel →4 Responses to Puzzling Out Brew House Efficiency
Pingback: documenting my homebrewing technique | found drama
Pingback: Continued Meditation on Brew House Efficiency | found drama
Pingback: Homebrew #95: Hoarder Intervention #3 | found drama
Leave a Reply